Rani Devi, at 60, can no longer read a story book to her grandchildren. A diabetic for the last 20 years, she was recently diagnosed with Diabetic Macular Edema (DME), a condition that has slowly nibbled away at her vision. If untreated, DME can lead to blindness. However, if detected early, the condition can be slowed down and a person’s vision can be saved.
Now, a team of researchers from three institutes – IISER Kolkata, L.V. Prasad Eye Institute from Hyderabad and BARC in Visakhapatnam – have found a new analysis technique to detect DME in its early stages, a discovery that will be a big boon to diabetics like Rani Devi.
The analysis method comes from a well-known mathematical concept – the study of patterns that repeat themselves at every scale – called fractals. Multifractals are a special class of self-similar patterns that are composed of multiple fractal subsets, and are known to occur in a variety of disparate systems. Multifractality is exhibited by diverse phenomena such as the length of coastlines, stock market fluctuations, internet traffic, and most importantly, in biological tissue structures. Tissues in our bodies such as the retina of the eye, exhibit multifractality in the way they refract or bend light. By analysing this pattern of multifractality in images of eye tissues, researchers can now detect abnormalities such as DME.
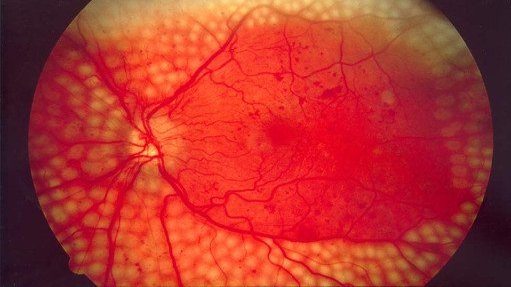
DME is a disorder in the eye that occurs in roughly 32 million people with diabetes worldwide. A steady deposition of fluid and proteins through leaky blood vessels in the macula or yellow-spot in the centre of the eye’s retina causes the area to thicken and swell, affecting vision. DME is generally detected through a routine scan called Optical Coherence Tomography (OCT), that uses light to form a 3‑dimensional image of the retina. Through the scan, doctors can identify the thickening in the macula that is characteristic of DME.
However, subtle changes in the retinal tissues during the early stages of the disease may not be detected in thickness measurements. Nevertheless, information about such changes are picked up by OCT imaging.
To draw out this ‘hidden information”, the researchers used another mathematical technique called Fourier domain analysis. This enabled the extraction of measures – called spatial frequency spectra – of how uneven the refractive indices across the retinal layers were. In DME-affected retinas, one of the twelve layers of the retina called the outer plexiform layer showed a distinctive two-peak pattern in its spatial frequency spectrum compared to the single peak in normal healthy retinas.
When the spatial frequency spectra of each of the retinal layers were subjected to further investigation using Multi-Fractal De-trended Fluctuation Analyses (MFDFA), other interesting patterns were revealed. Results indicated that in DME-affected retinas, the outer plexiform layer showed higher randomness in its spatial frequency spectrum, and a higher degree of multifractality than healthy retinas.
“When we used MFDFA to glean more information about changes in the retina, we found clear differences between DME-affected and healthy retinas. However, although we focussed only on the outer plexiform layer while studying DME, our results also show promise in detecting other retinal conditions such as age-related macular degeneration,” says Nandan Das, who is one of the lead authors of a paper detailing these results in the Journal of Biomedical Optics. “Furthermore, the analysis is quick, and can give doctors useful information in a short period of time, which is vital for diagnosis,” he adds.
“So far, the medical community use OCT, apart from conventional morphology, to look for thickness variations for the different retinal layers, especially the thickness of the RNFL, the retinal nerve fiber layer for diagnosing glaucoma. They don’t really get into other aspects such as the minor variations in the refractive index in the different layers of the retina”, says Divakar Rao, who first proposed the idea for this study. “I had heard that Nirmalya Ghosh and his group at IISER were using multifractal analyses to glean more information from microscopy images. It appeared to me a natural extension of investigation that we could apply this technique to look at the variations in the refractive index of the retinal layers via OCT images,” he adds.
Nirmalya Ghosh from IISER Kolkalta, who was also involved in the study advises caution in interpreting the future applications of the technique, “What we have described in this paper is a very preliminary result. We still have to do a lot of rigorous testing with lots of trials before we can apply this technique in clinics. But right now, what we have is a very promising technique for early diagnosis of a variety of retinal problems. Although OCT data contains all this information, we were unable to process it before. Now, this is possible.”